The new report just published the future of high-intensity sweeteners in China
Sweeteners are the food additives
used to sweeten food products, i.e., the food additives listed as sweeteners in China’s national standard GB2760-1996, hygienic standards for uses of food additives and dietary supplements. 20 sweeteners in total have been permitted to be used in food in China by the end of 2007. There are totally 13 HIS listed in GB 2760 allowed to be used as food additives or dietary supplements by the end of 2007. Most of these HIS are 100 or more times sweeter than sugar except cyclamate and calcium cyclamate, which are both 30~80 times sweeter than sugar. In this report, analysis has been focused on the following HIS, which are the major categories in China:
– Aspartame
– Ace-K
– Saccharin
– Cyclamate
– Sucralose
– Stevioside
As the major competitors of HIS, sugar and sugar alcohols in China are briefly introduced from the aspects of production, demand and trade.
Why you should buy this report:
To gain most updated info of China’s production and market of HIS, and in-depth analysis of China’s HIS industry.
To keep track of the impacts of guideline and legislation related to food additives.
To get insight into the latest consumer’s trends and market dynamics of HIS in China
To gain vital business intelligence out of China ahead of the competition
To find out where the Chinese HIS market could go next and how your business can get involved
To keep you informed of your competitors’ activities in China
Report highlights
China is the major HIS supplier to the world, and about 70% of China’s HIS output volume has been exported in recent years. China has witnessed a growth in output value of all the major HIS in recent years. The fastest is sucralose, then aspartame, growing by 240% and 42% annually from 2002~2006, in spite that the price of sucralose and aspartame has both been declining in recent years. The output value of saccharin and cyclamate also grows by 3.1% and 4.6% respectively, although their output volume both has shrunk.
China imports only a little HIS and in recent 3 years, China’s HIS import volume has been no more than 100 tonnes, accounting for less than 0.5% of China’s HIS consumption. China’s HIS import volume reached the peak at 216 tonnes in 2004.
The total HIS consumption by volume in China decreased from 34.8 kt in 2002 to 23.3 kt in 2006, declining by CAGR 9.5%. This decline in consumption volume is attributed to China’s HIS consumption structure change in recent years. Consumption of HIS with lower unit sweetness has shrunk and that with higher sweetness has expanded. For example, the consumption volume of cyclamate in China decreased by 14.1% annually from 2002 to 2006.
From 2002 to 2006, the total sweetness consumption in China grows by 6.6% annually. The consumption of sugar and starch sugar grows by CAGR 4.9% and 25.6% respectively, and annually during 2002~2006. However, HIS consumption declines by 0.6% annually from 2002~2006. Obviously, HIS is not as competitive as sugar and starch sugar, although the unit sweetness price of HIS is just about 1/10 of that of sugar and starch sugar.
Food & beverage industry is the major consumption field for HIS in 2007, consuming about 75% of HIS by volume, and 81% by value. For aspartame, ace-K and sucralose, the figure is much higher. Except saccharin, over 80% of the rest HIS is consumed in food & beverage industry.
Jiangsu Changzhou Niutang Chemical Plant Co., Ltd.; Beijing VitaSweet Co, Ltd. ;Shandong Huaxian Stevia Co., Ltd.; Guangdong Strong Group Co., Ltd.; Shanghai Golden Monkey Group Co., Ltd.
TABLE OF CONTENT
Executive summary
I Sweetener overview in China
I-1 Classification and major categories of sweetener in China
I-2 Sugar industry in China
– Planting situation of sugar cane and sugar beet in China
– Production of sugar and its distribution
– Trade of sugar
– Demand of sugar
I-3 Sugar alcohols industry
– Production of sugar alcohols and its distribution
– Trade of sugar alcohols
– Demand of sugar alcohols
I-4 Eating habit of sweetener in China
I-5 Government policies and their influence on sweetener
I-6 Development trend of sweetener in China
II Brief Introduction to HIS industry in China
II-1 Classification and major categories of HIS in China
II-2 Development History of HIS Industry in China
III Production and Market of HIS in China
III-1 Production Situation of HIS in China
III-2 Brief Introduction to the Major HIS in China
III-2.1 Aspartame
III-2.2 Acesulfame-K
III-2.3 Saccharin
III-2.4 Cyclamate
III-2.5 Sucralose
III-2.6 Stevioside
III-2.7 Others
III-3 Pricing of HIS
III-4 Import & Export Situation of HIS in Recent Years
III-5 Demand for HIS in China
III-5.1 Market size and share of each major HIS in China (by volume and by value)
II-5.1.1 Market size of total HIS
II-5.1.2 Market size of aspartame
II-5.1.3 Market size of Ace-K
II-5.1.4 Market size of saccharin
II-5.1.5 Market size of cyclamate
II-5.1.6 Market size of sucralose
II-5.1.7 Market size of stevioside
III-5.2 Consumption pattern of HIS in China
II-5.2.1 Total HIS
II-5.2.2 Aspartame
II-5.2.3 Ace-K
II-5.2.4 Saccharin
II-5.2.5 Cyclamate
II-5.2.6 Sucralose
II-5.2.7 Stevioside
III-5.3 Brief introduction to major end use segments
III-5.3.1 Food industry
III-5.3.1.1 – Confection
III-5.3.1.2 – Tabletop sweetener
III-5.3.1.3 – Jelly
III-5.3.1.4 – Glace fruit
III-5.3.1.5 – Canned food
III-5.3.1.6 – Pickles
III-5.3.1.7 – Seasonings
III-5.3.1.8 – Bakery food (cake, bread, biscuit, toasted seeds and nuts)
III-5.3.1.9 – Health food
III-5.3.2 Beverage industry
III-5.3.2.1 – Soft beverage
III-5.3.2.2 – Solid beverage
III-5.3.2.3 – Dairy product
III-5.3.2.4 – Alcohol drinks
III-5.3.3 Pharmaceuticals
III-5.3.4 Personal care products (Toothpaste, lipstick, etc.)
III-5.3.5 Others (feed, chemical, plating, etc.)
III-5.4 Consumption character of HIS in China
III-6 Growing Points and Hot Spots in China
IV Future Forecast
IV-1 Key Factors and Driven Forces for the Development of HIS Industry in China
IV-1.1 Intrinsic factors
IV-1.2 Competitors
IV-1.3 End use segments
IV-1.4 Micro-economy and policies
IV-2 Future Forecast on the demand for HIS in Next 10 Years
IV-2.1 Introduction
IV-2.2 Market forecast: HIS in major segments, 2008~2017
IV-2.2.1 Gummy candy
IV-2.2.2 Tabletop sweeteners
IV-2.2.3 Jelly
IV-2.2.4 Glace fruit
IV-2.2.5 Canned food
IV-2.2.6 Pickles
IV-2.2.7 Soy sauce
IV-2.2.8 Bakery foods
IV-2.2.9 Carbonated beverage
IV-2.2.10 Juice beverage
IV-2.2.11 Tea beverage
IV-2.2.12 Milk beverage
IV-2.2.13 Instant coffee
IV-2.2.14 Yogurt
IV-2.2.15 Ice cream
IV-2.2.16 Distilled spirit
IV-2.2.17 Toothpaste
V Conclusion, Recommendation
VI Appendix
VI-1 Profile of major HIS producers in China
VI-1.1 Aspartame producers
VI-1.2 Ace-K producers
VI-1.3 Saccharin producers
VI-1.4 Cyclamate producers
VI-1.5 Sucralose producers
VI-1.6 Stevioside producers
VI-2 Profile of major HIS end users in China
VI-2.01 Fujian Yake Food Co., Ltd.
…….
VI-2.14 Guangdong Foshan Haitian Flavoring & Food Co., Ltd.
LIST OF TABLES
Table I-1-1 Sweeteners listed in GB2760-1996 (including supplements by the end of 2007)
Table I-2.1-1 Planting area of sugar cane and sugar beet in China,unit: k hectare
Table I-2.1-2 Total planting area of sugar cane and the major planting provinces, k hectare
Table I-2.1-3 Total planting area of sugar beet and the major planting provinces, k hectare
Table I-2.2-4 Cane sugar output in major production areas of China during 1990/91~2006/07, kilotonne
Table I-2.2-5 Beet sugar output in major production areas 1990/91~2006/07, kilotonnes
Table I-2.3-1 Import & export volume of sugar, 2000~2007, kilotonnes
Table I-2.3-2 Import volume with different trade type, 2000~2007, kilotonnes
Table I-2.3-3 Export volume with different trade types, 2000~2007, kilotonnes
Table II-1-1 Comparison of high intensity sweeteners listed in national standard GB2760 and its supplements till the end of 2007
Table II-1-2 Comparison of the main HIS used in China.
Table III-1-1 Production situation of major HIS in China
Table III-1-2 Output of major HIS breakdown by location in China, 2006
Table III-2.1-1 Output of aspartame in China breakdown by location, 2006
Table III-2.1-2 Active manufacturers of aspartame in China
Table III-2.2-1 Output of Ace-K in China breakdown by location, 2006
Table III-2.2-2 Active manufacturers of Ace-K in China
Table III-2.2-3 Manufacturers of Ace-K and their capacity and output
Table III-2.2-4 Application fields of aspartame, permitted in GB2760-1996
Table III-2.3-1 Output of saccharin in China breakdown by locations, 2006
Table III-2.3-2 Manufacturers of saccharin in China
Table III-2.3-3 Application fields of saccharin, permitted in GB2760-1996.
Table III-2.4-1 Output of cyclamate in China breakdown by locations, 2006
Table III-2.4-3 Application fields of cyclamate permitted in GB2760-1996
Table III-2.5-1 Output of sucralose in China breakdown by locations, 2006
Table III-2.5-2 Manufacturers of sucralose in China
Table III-2.5-3 Manufacturers of sucralose and their capacity and output in China
Table III-2.5-4 Sucralose-related patents in China
Table III-2.5-5 Important patents on sucralose preparation method in US
Table III-2.5-6 Application fields of sucralose approved in GB2760-1996
Table III-2.6-1 Output of stevioside in China breakdown by locations, 2006
Table III-2.6-2 Manufacturers of stevioside in China
Table III-2.6-3 Manufacturers of stevioside and their capacity and output in China
Table III-3-1 Specification of aspartame produced by SinoSweet
Table III-3-2 Specification of aspartame produced by Zhejiang Niutang
Table III-3-3 Specification and prices of stevioside produced in China Unit: RMB/kg
Table III-5.2.1 -1 End use segments and HIS consumption thereof in 2007
Table III-5.2.2 -1Aspartame end use segments and the consumption thereof in 2007
Table III-5.2.3-1 End use segments of Ace-K and the consumption thereof in 2007
Table III-5.2.4-1 End use segments of saccharin and the consumption thereof in 2007
Table III-5.2.5-1 End use segments of cyclamate and the consumption thereof in 2007
Table III-5.2.6-1 End use segments of sucralose and the consumption thereof in 2007
Table III-5.2.7-1 End use segments of stevioside and the consumption thereof in 2007
Table III-5.3-1 Inspection results of saccharin in foods in Guangdong province, 2000~2005
Table III-5.3-2 Inspection results of cyclamate in foods in Guangdong province, 2000~2005
Table III-5.3-3 Inspection results of Ace-K in foods in Guangdong province, 2000~2005
Table III-5.3.1.1 -1 HIS consumption situation in gummy candy, 2007
Table III-5.3.1.1 -2 Major gummy candy producers
Table III-5.3.1.1 -3 HIS consumed in oral care strips in 2007
Table III-5.3.1.1 -4 Main producers of oral care strips in China
Table III-5.3.1.2-1 HIS consumption in tabletop sweeteners in China, 2007
Table III-5.3.1.2-2 Main producers of tabletop sweetener
Table III-5.3.1.3-1 HIS consumption in jelly in 2007
Table III-5.3.1.3-2 Major jelly manufacturers and HIS used by them
Table III-5.3.1.4-1 HIS consumption in glace fruits in 2007
Table III-5.3.1.4-2 Major manufacturers of glace fruits and HIS used by them
Table III-5.3.1.5 -1 HIS consumption in canned food, 2007
Table I-5.3.1.6-1 HIS consumption in pickles, 2007
Table I-5.3.1.6-2 Major manufacturers of pickles and HIS used by them
Table III-5.3.1.7 -1 HIS consumption in soy sauce, 2007
Table III-5.3.1.7 -2 Major manufacturers and HIS used by them
Table II-5.3.1.8 -1 HIS consumption in bakery foods, 2007
Table III-5.3.1.9-1 HIS consumption in health foods, 2007
Table III-5.3.2.1-1 HIS consumption in carbonated beverage, 2007
Table III-5.3.2.1-2 HIS consumption in juice beverage, 2007
Table III-5.3.2.1-3 HIS consumption in tea beverage, 2007
Table III-5.3.2.1-4 Tea beverage manufacturers and HIS consumed by them
Table III-5.3.2.2 -1 Solid beverage manufacturers and HIS consumed by them
Table III-5.3.2.3 -1 Manufacturers of dairy products and HIS used by them
Table III-5.3.2.3 -2 HIS consumption in yogurt, 2007
Table III-5.3.2.3 -3 HIS consumption in milk drinks, 2007
Table III-5.3.2.3 -4 HIS consumption ice cream, 2007
Table III-5.3.2.4-1HIS consumption in distilled spirits, 2007
Table III-5.3.4-1 HIS consumption in toothpaste, 2007
Table IV-1.2 -1 Market shares of HIS, sugar and starch sugar in China,
Table IV-1.3-1 HIS consumption in food & beverage industry
Table IV-1.3-2 Performance of beverage industry, Jan ~ August in 2007
Table IV-1.3-3 Performance of food manufacturing industry, Jan ~ August in 2007
Table IV-1.3-4 Performance of food processing industry, Jan ~ August in 2007
Table IV-1.3-5 Output of major food products in 2000 and 2005, kilotonne
Table IV-1.3-6 Development target of food & beverage industry in the Eleventh-five-year
Table IV-1.3-7 Development target and directions for the foodstuff processing industry
Table IV-1.3-8 Development target and directions for the fruit & vegetable processing industry
Table IV-1.3-9 Development target and directions for the dairy product industry
Table IV-1.3-10 Development target and directions for beverage industry
Table IV-1.3-11 Development target and directions for the sugar industry
LIST OF FIGURES
Figure I-1-1 Classification of sweeteners
Figure I-2.2-1 Output of sugar in China, 1990/91~2006/07 Unit: kilotonne
Figure I-2.2-2 Percentages of cane sugar and beet sugar in China, 1990/91~2006/07
Figure I-2.2-3 Sugar output in major production areas in China in 2006/07
Figure I-2.4-1 Sugar consumption in China, 1990/91~2006/07, kilotonnes
Figure I-2.4-2 China’s sugar consumption per capita, 1990/91~2006/07, kg/a
Figure I-3.1-1 Sugar alcohol output in China, 2000~2006, tonne
Figure I-3.1-2 The output of sorbitol in China, 2000~2007, tonne
Figure I-3.1-3 Xylitol output in China, 2000~2006, tonne
Figure I-3.1-4 Maltitol output in China, 2000~2006, tonne
Figure I-3.1-5 Mannitol output in China, 2000~2006, tonne
Figure I-3.1-6 Erythritol output in China, 2000~2007, tonne
Figure I-3.2-1 Import and export of sugar alcohols in China, 2000~2006, tonne
Figure I-3.2-2 Import and export volume of sorbitol in China, 2000~2006, tonne
Figure I-3.2-3 Import and export volume of mannitol in China, 2000~2006, tonne
Figure I-3.2-4 Import and export volume of xylitol in China, 2000~2006, tonne
Figure I-3.3-1 The apparent consumption of sugar alcohols in China, 2000~2006, tonne
Figure I-3.3-2 Xylitol apparent consumption in China, 2000~2007, tonne
Figure I-3.3-3 Maltitol apparent consumption in China, 2000~2007, tonne
Figure I-3.3-4 Mannitol apparent consumption in China, 2000~2007, tonne
Figure I-4-1 The percentages of population eating different types of foods 5~7 times per week in Hangzhou, 2007
Figure I-4-2 The percentages of populations eating sweet foods 3 or more times per week with different education levels in Hangzhou, 2007
Figure I-4-3 The percentage of population eating sweet foods 3 or more times per week in different ages in Hangzhou, 2007
Figure III-1-1Output of HIS in China, 2000~2007, tonnes
Figure III-1-2 CAGR ’02~’06 of output volume of each major HIS in China, %
Figure III-1-3 Output sweetness of HIS, 2000~2007, tonnes
Figure III-1-4 Output value of HIS in China, 2001~2007, RMB million
Figure III-1-5 CAGR of the output value of each HIS in China, ’02~’06, %
Figure III-1-6 Product structure of HIS industry in China, by volume, 2000~2007
Figure III-1-7 Product structure of HIS industry in China, by value, 2000~2007
Figure III-1-8 Percentages of the output of each HIS in China, 2006,%
Figure III-1-9 Percentages of the output sweetness of each HIS in China, 2006, %
Figure III-1-10 Output value and the percentage of each HIS in China, 2006, RMB Million, %
Figure III-2.1-1 Output volume of aspartame in China, 2000~2007, tonne
Figure III-2.1-2 Output value of aspartame in China, 2001~2007, RMB million
Figure III-2.2-1 Output volume of Ace-K in China, 2000~2007, tonne
Figure III-2.2-2 Output value of Ace-K in China, 2000~2007, RMB million
Figure III-2.3-1 Output volume of saccharin in China, 2000~2007, tonne
Figure III-2.3-2 Output value of saccharin in China, 2000~2007, RMB million
Figure III-2.4-1 Output volume of cyclamate in China, 2000~2007, tonne
Figure III-2.4-2 Output value of cyclamate in China, 2000~2007, RMB million
Figure III-2.5-1 Output of sucralose in China, 2000~2007, tonne
Figure III-2.5-2 Output value of sucralose in China, 2001~2007, RMB million
Figure III-2.6-1 Output volume of Stevioside in China, 2000~2007, tonne
Figure III-2.6-1 Output volume of Stevioside in China, 2000~2007, tonne
Figure III-2.6-2 Output value of Stevioside in China, 2000~2007, RMB million
Figure III-4-1 Export & output volume of HIS in China, 2002~2007
Figure III-4-2 Export structure of HIS in China by volume, 2002~2007
Figure III-4-3 Export volume of aspartame in China, 2002~2006, tonne
Figure III-4-4 Export volume of Ace-K from 2002~2007, tonne
Figure III-4-5 Export volume of saccharin from 2002~2006, tonne
Figure III-4-6 Export volume of cyclamate from 2002~2006, tonne
Figure III-4-7 Export volume of sucralose from 2002 to 2006, tonne
Figure III-4-8 Export volume of stevioside from 2002~2006, tonne
Figure III-5.1-1 Market share of each major HIS by volume in China in 2006, tonne, %
Figure III-5.1-2 Market share of each major HIS by sweetness in China in 2006, tonne, %
Figure III-5.1-3 Market share of each major HIS by value in China in 2006, RMB million, %
Figure III-5.1.1 -1 Market size of HIS by volume in China, 2002~2007, tonne
Figure III-5.1.1-2 Market size of HIS by value in China, 2002~2007, RMB million
Figure III-5.1.1-3 Market size of HIS by sweetness in China, 2002~2007, tonne
Figure III-5.1.2-1 Market size of aspartame by volume, 2001~2007, tonne
Figure III-5.1.2-2 Market size of aspartame by value, 2001~2007, RMB million
Figure III-5.1.3-1 Market size of Ace-K by volume, 2001~2007, tonne
Figure III-5.1.3-2 Market size of Ace-K by value, 2001~2007, RMB million
Figure III-5.1.4-1 Market size of saccharin by volume, 2001~2007, tonne
Figure III-5.1.4-2 Market size of saccharin by value, 2001~2007, RMB million
Figure III-5.1.5 -1 Market size of cyclamate by volume, 2001~2007, tonne
Figure III-5.1.5 -2 Market size of cyclamate by value, 2001~2007, RMB million
Figure III-5.1.6-1Market size of sucralose by volume, 2001~2007, tonne
Figure III-5.1.6-2 Market size of sucralose by value, 2001~2007, RMB million
Figure III-5.1.7-1 Market size of stevioside by volume, 2001~2006, tonne
Figure III-5.1.7-2 Market size of stevioside by value, 2001~2006, RMB million
Figure III-5.3.1.1 -1 Output of confection in China, 2001~2007, tonne
Figure III-5.3.1.1 -2 Output of gummy candy in China, 2001~2007, tonne
Figure III-5.3.1.2-1 Output of tabletop sweeteners in China, 2001~2007, tonne
Figure III-5.3.1.3-1 Output of jelly in China, 2002~2007, tonne
Figure III-5.3.1.4-1 Output of glace fruits in China, 2001~2007, tonne
Figure III-5.3.1.5 -1 Output of canned food in China, 2001~2007, tonne
Figure III-5.3.1.6-1 Output of pickles in China, 2001~2007, tonne
Figure III-5.3.1.7 -1 Output of soy sauce in China, 2001~2007, tonne
Figure III-5.3.1.8 -1 Output of bakery foods in China, 2001~2007, tonne
Figure III-5.3.1.9-1 Output of health food in China, 2001~2007, tonne
Figure III-5.3.2.1-1 Output of carbonated beverage in China, 2001~2007, tonne
Figure III-5.3.2.1-2 Output of juice beverage in China, 2001~2007, tonne
Figure III-5.3.2.2 -1 Output of instant coffee in China, 2001~2007, tonne
Figure III-5.3.2.3 -1 Output of yogurt in China, 2001~2007, tonne
Figure III-5.3.2.3 -3 Output of milk containing milk in China, 2001~2007, tonne
Figure III-5.3.2.3 -4 Output of ice cream in China, 2001~2007, tonne
Figure III-5.3.2.4-1 The output of distilled spirits in China from 2001 to 2007, tonne
Figure III-5.3.4-1 Output of toothpaste in China, 2001~2007, tonne
Figure III-5.4-1 Structure change of HIS consumption by volume in China since 2002
Figure III-5.4-2 Structure change of HIS consumption by sweetness in China since 2002
Figure III-5.4-3 Averaged unit sweetness of HIS consumed in China
Figure III-5.4-4 Average unit sweetness price of HIS consumed in China since 2002
Figure III-5.4-5 Growth rates of HIS, sugar and sugar alcohols since 2003, %
Figure III-6-1 Forecast of aspartame demand to 2018, tonne
Figure III-6-2 Forecast of Ace-K demand to 2018, tonne
Figure III-6-3 Forecast of sucralose demand to 2018, tonne
Figure IV-1.2 -1 Sweetness consumption in China, 2002~2007, tonne
Figure IV-1.4-1 Population growth in China, 1995~2007
Figure IV-1.4-2 GDP growth in China, 1995~2007
Figure IV-1.4-3 Import & export growth in China, 1995~2007
Figure IV-2.2-1 Future HIS demand to 2016 based on the market forecast in major segments
Figure IV-2.2.1-1 HIS consumption in gummy candy, 2002~2007, tonne
Figure IV-2.2.1-2 Growth of HIS consumption in gummy candy, 2003~2007, %
Figure IV-2.2.1-3 Projection of future HIS demand from gummy candy, 2008~2017, tonne
Figure IV-2.2.2-2 HIS consumption in tabletop sweeteners, 2002~2007, tonne
Figure IV-2.2.2-3 Growth of HIS consumption in tabletop sweeteners, 2003~2007, %
Figure IV-2.2.2-4 Projection of future HIS demand from tabletop sweeteners, 2008~2017, tonnes
Figure IV-2.2.3-1 HIS consumption in jelly, 2002~2007, tonne
Figure IV-2.2.3-2 Growth of HIS consumption in jelly, 2003~2007, %
Figure IV-2.2.3-3 Projection of future HIS demand from jelly, 2008~2017, tonne
Figure IV-2.2.4-1 HIS consumption in glace fruit, 2002~2007, tonne
Figure IV-2.2.4-2 Growth of HIS consumption in glace fruit, 2003~2007, %
Figure IV-2.2.4-3 Projection of future HIS demand from glace fruit, 2008~2017, tonne
Figure IV-2.2.5-1 HIS consumption in canned food, 2002~2007, tonne
Figure IV-2.2.5-2 Growth of HIS consumption in canned food, 2003~2007, %
Figure IV-2.2.5-3 Projection of future HIS demand from canned food, 2008~2017, tonne
Figure IV-2.2.6-1 HIS consumption in pickles, 2002~2007, tonne
Figure IV-2.2.6-2 Growth of HIS consumption in pickles, 2003~2007, %
Figure IV-2.2.6-3 Projection of future HIS demand from pickles, 2008~2017, tonne
Figure IV-2.2.6-2 Growth of HIS consumption in pickles, 2003~2007, %
Figure IV-2.2.6-3 Projection of future HIS demand from pickles, 2008~2017, tonne
Figure IV-2.2.7-1 HIS consumption in soy sauce, 2002~2007, tonne
Figure IV-2.2.7-2 Growth of HIS consumption in soy sauce, 2003~2007, %
Figure IV-2.2.7-3 Projection of future HIS demand from soy sauce, 2008~2017, tonne
Figure IV-2.2.8-1 HIS consumption in bakery foods, 2002~2007, tonne
Figure IV-2.2.8-2 Growth of HIS consumption in bakery foods, 2003~2007, %
Figure IV-2.2.8-3 Projection of future HIS demand from bakery foods, 2008~2017, tonne
Figure IV-2.2.9-1 HIS consumption in carbonated beverage, 2002~2007, tonne
Figure IV-2.2.9-2 Growth of HIS consumption in carbonated beverage, 2003~2007, %
Figure IV-2.2.9-3 Projection of future HIS demand from carbonated beverage, 2008~2017, tonne
Figure IV-2.2.10-1 HIS consumption in juice beverage, 2002~2007, tonne
Figure IV-2.2.10-2 Growth of HIS consumption in juice beverage, 2003~2007, %
Figure IV-2.2.10-3 Projection of future HIS demand from juice beverage, 2008~2017, tonne
Figure IV-2.2.11-1 HIS consumption in tea beverage, 2002~2007, tonne
Figure IV-2.2.11-2 Growth of HIS consumption in tea beverage, 2003~2007, %
Figure IV-2.2.11-3 Projection of future HIS demand from tea beverage, 2008~2017, tonne
Figure IV-2.2.12-1 HIS consumption in milk containing beverage, 2002~2007, tonne
Figure IV-2.2.12-2 Growth of HIS consumption in milk containing beverage, 2003~2007, %
Figure IV-2.2.12-3 Projection of future HIS demand from milk containing beverage, 2008~2017, tonne
Figure V-2.2.13-1 HIS consumption in instant coffee, 2002~2007, tonne
Figure V-2.2.13-2 Growth of HIS consumption in instant coffee, 2003~2007, %
Figure V-2.2.13-3 Projection of future HIS demand from instant coffee, 2008~2017, tonne
Figure IV-2.2.14-1 HIS consumption in yogurt, 2002~2007, tonne
Figure IV-2.2.14-2 Growth of HIS consumption in yogurt, 2003~2007, %
Figure IV-2.2.14-3 Projection of future HIS demand from yogurt, 2008~2017, tonne
Figure IV-2.2.15-1 HIS consumption in ice cream, 2002~2007, tonne
Figure IV-2.2.15-2 Growth of HIS consumption in ice cream, 2003~2007, %
Figure IV-2.2.15-3 Projection of future HIS demand from ice cream, 2008~2017, tonne
Figure IV-2.2.16-1 HIS consumption in distilled spirit, 2002~2007, tonne
Figure IV-2.2.16-2 Growth of HIS consumption in distilled spirit, 2003~2007, %
Figure IV-2.2.16-3 Projection of future HIS demand from distilled spirit, 2008~2017, tonne
Figure IV-2.2.17-1 HIS consumption in toothpaste, 2002~2007, tonne
Figure IV-2.2.17-2 Growth of HIS consumption in toothpaste, 2003~2007, %
Figure IV-2.2.17-3 Projection of future HIS demand from toothpaste, 2008~2017, tonne


 (No Ratings Yet)
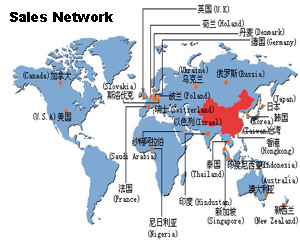
Leave your response!